
Comet ISON Observations by an Amateur
Observer
Webmaster: Bruce Gary, Last
updated: 2013.09.15, 23.4 UT
This website is a record of observations of Comet C/2012 S1 (ISON) by amateur Bruce Gary, using a Celestron 11-inch telescope at the Hereford Arizona Observatory (G95). My long-term goal is to monitor evolution of the coma by measuring brightness versus diameter at 3 wavelengths (g'r'i'). For now the main objective is to measure brightness and monitor it for outbursts. Measurements on 4 dates (after reappearing from behind the sun) show that it is fainter than expected and barely brightening at the expected rate. ISON has probably passed the "frost line" so why isn't it brightening instead of fading with respect to a model?
Recent Updates:
Sep 15, 23.4 UT: Added 14-image animation of Whitmer images.
Sep 15, 22.1 UT: Added analysis of Whitmer Sep 15 image, showing the expected brightening of ~ 0.17 mag in 4 days.
Sep 13, 00.3 UT: Added analysis of Whitmer Sep 13 image, showing comet brightness versus coma diameter included in photometry aperture for date
Current Magnitude Model Fit
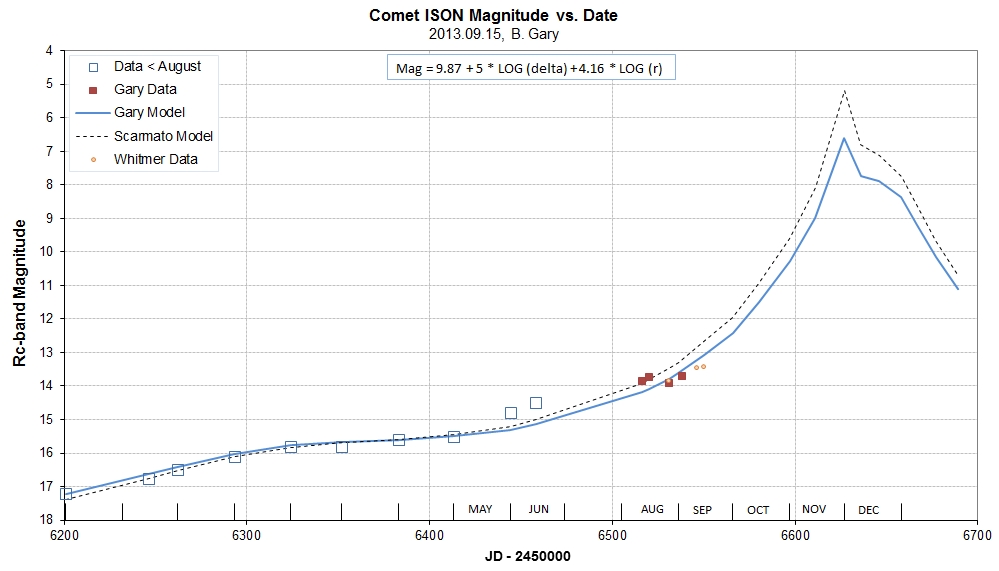
My model fit to existing R-mag measurements. My r'-mag's have been adjusted by -0.19 mag to be equivalent to Rc-mag's. A chi-square fitting procedure
was used, with adopted group averages and SE's for pre-August data (using the Scarmato & Morales plot). No physics-based constraints on the fitted solution were employed so maybe the 4.42 * LOG(r) term is "unphysical." A LOG(r) coefficient below 5 corresponds to the comet fading in absolute brightness as it gets closer to the sun, which seems "unphysical" to me. I'm an amateur on comet matters so I don't know if there's a serious flaw in this fit.
____________________________________________________________________________________________
2013.09.15 Whitmer R-Band Image Analysis
Dennis Whitmer obtained 40 useful images this morning (20 20-sec & 20 60-sec). I've used 14 of the 60-second images to create a GIF animation.
Animation using the first 14 images from the 60-second image set. 14-inch Celestron, binned 2x2.
Below is an analysis using 4 of the 60-sec images for coma's brightness versus diameter.
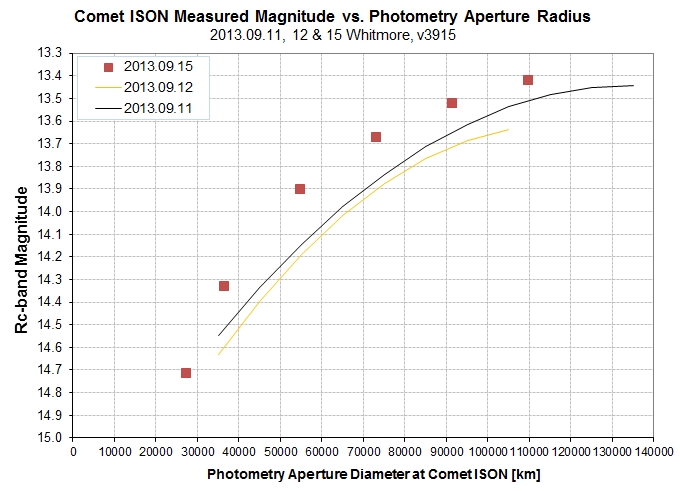
R-band brightness versus amount of coma included in photometry aperture, for Sep 15 (Whitmer data); trace of previous date's Whitmer fit shows that there was a 0.17 magnitude brightening from Sep 11 to Sep 15, versus the predicted 0.12 mag brightening.
The brightening during the past 4 dates is compatible with the simple model prediction and calibration uncertainty. The coma structure difference is probably not real given the fact that all images are binned 2x2 and the image scale is 1.56 "arc/pixel.
2013.09.12 Whitmer R-Band Image Analysis
Dennis Whitmer obtained 5 useful images this morning, and I analyzed the comet coma's brightness versus diameter.
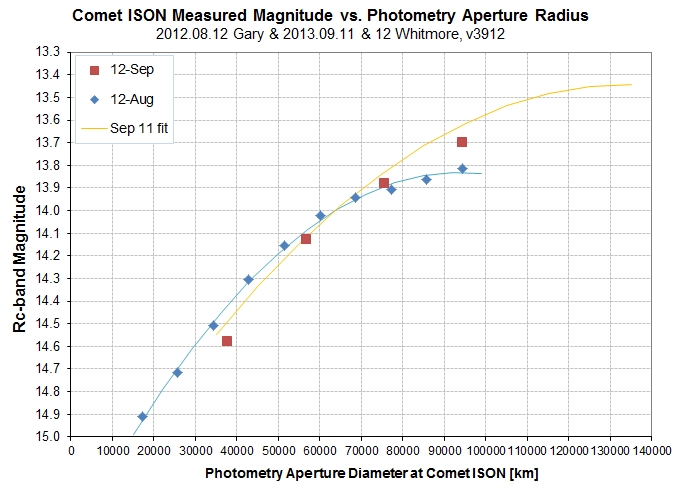
R-band brightness versus amount of coma included in photometry aperture, for Aug 12 (Gary data) and Sep 12 (Whitmer data); trace of previous date's Whitmer fit shows that there was essentially no change from Sep 11 to Sep 12.
The slight fade for Sep 12 compared with Sep 11 (of ~ 0.07 mag) isn't significant, considering that the systematic error uncertainty is estimated to be greater than this.
2013.09.11 Whitmer R-Band Image & Analysis
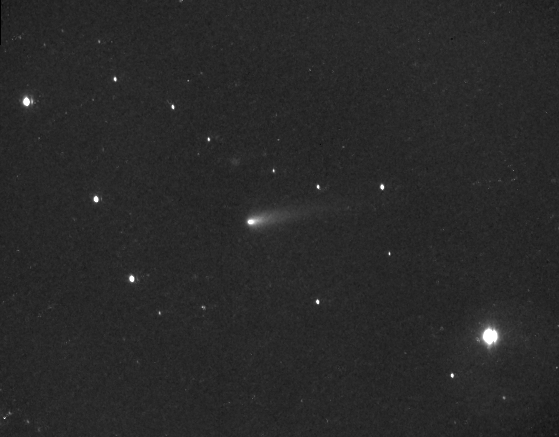
Three 4-minute exposures, comet aligned. 14-inch, star auto-guided.
READ MORE


No comments